- Your cart is empty
- Continue Shopping
Training Institute Dashboard Using Power BI
-50%

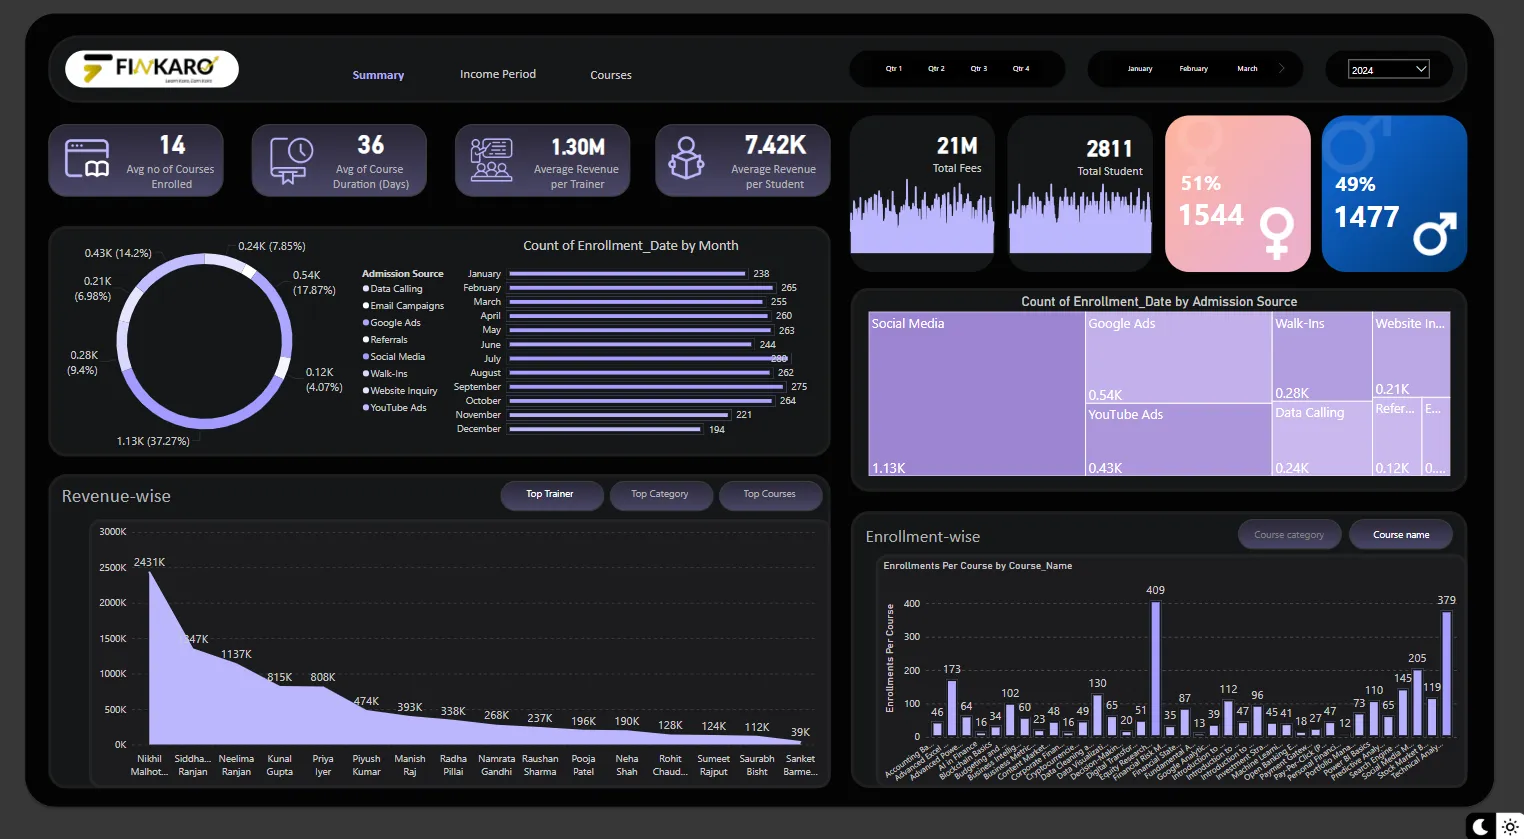
Training Institute Dashboard Using Power BI
₹499Current price is: ₹499. Original price was: ₹999.
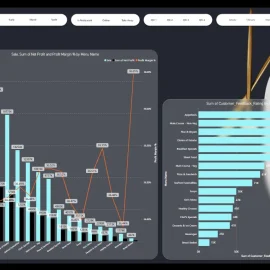
Finkaro Institute is a premier training institute offering high-quality education through online, offline, and blended learning modes. The institute specializes in upskilling professionals and students across various domains, including IT, Business Management, Finance, Marketing, and Soft Skills. With a strong presence across multiple locations, Finkaro Institute aims to bridge the skill gap and empower learners with industry-relevant knowledge.
Power BI Content
- Power BI File (.pbix)
- Xl Data (xlsx)
- Preview Asset(Image File)
Availability: 997 in stock
Add to cart
Buy Now
Summary
Overview
Finkaro Institute is a premier training institute offering high-quality education through online, offline, and blended learning modes. The institute specializes in upskilling professionals and students across various domains, including IT, Business Management, Finance, Marketing, and Soft Skills. With a strong presence across multiple locations, Finkaro Institute aims to bridge the skill gap and empower learners with industry-relevant knowledge.
Objective
The institute aims to develop a comprehensive and intelligent Learning Management System (LMS) Dashboard to:
✔ Enhance training efficiency and learner engagement.
✔ Optimize course content and instructor effectiveness.
✔ Monitor key performance indicators (KPIs) to improve learning outcomes and business sustainability.
Few Learning & Operational KPIs
🔹 Course Completion Rate – Tracking learner progress and dropout rates.
🔹 Learner Engagement Score – Analyzing participation in assignments, quizzes, and discussions.
🔹 Trainer Effectiveness – Measuring instructor ratings, feedback, and performance.
🔹 Certification Rate – Monitoring successful course completion and certification issuance.
🔹 Mode of Learning Preference – Evaluating trends in online, offline, and hybrid learning adoption.
🔹 Skill Improvement Metrics – Assessing pre-training and post-training proficiency levels.
🔹 Time Spent on Learning – Analyzing average study duration for different courses.
Few Business Performance Metrics
🔹 Top Performing Courses – Identifying courses with the highest enrollment and completion rates.
🔹 Revenue per Course – Tracking profitability of individual training programs.
🔹 Student Satisfaction Score – Measuring feedback and course ratings.
🔹 Trainer Utilization Rate – Evaluating faculty workload and effectiveness.
🔹 Cost per Student Acquisition – Analyzing marketing spend vs. student enrollments.
🔹 Corporate Training Success Rate – Measuring business impact for enterprise clients.
This is a high-level summary. The actual LMS dashboard will integrate advanced analytics and AI-driven insights to enhance learning efficiency, optimize business performance, and support data-driven decision-making at all levels.
You must be logged in to post a review.
Related products
Advanced Perfume Business Dashboard Using Power BI
₹499Current price is: ₹499. Original price was: ₹999.
Optimized Power Generation Company Dashboard Using Power BI
₹499Current price is: ₹499. Original price was: ₹999.
Reviews
There are no reviews yet.