- Your cart is empty
- Continue Shopping
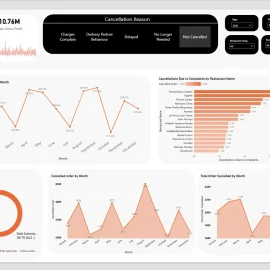
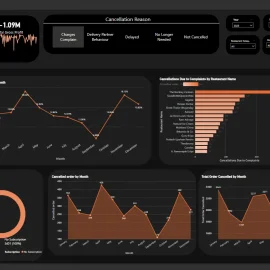
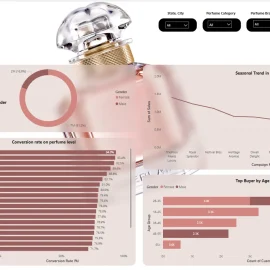
Advanced Tours & Travel Business Dashboard Using Power BI
-50%


Advanced Tours & Travel Business Dashboard Using Power BI
₹499Current price is: ₹499. Original price was: ₹999.
The company is a travel and tourism service provider, offering domestic and international tour packages, hotel bookings, ticketing, transportation, and customized itineraries. The business focuses on delivering seamless customer experiences, optimizing operations, and increasing profitability while managing bookings, partner networks, seasonal trends, and customer feedback.
Add to cart
Buy Now
Summary
Overview
The company is a travel and tourism service provider, offering domestic and international tour packages, hotel bookings, ticketing, transportation, and customized itineraries. The business focuses on delivering seamless customer experiences, optimizing operations, and increasing profitability while managing bookings, partner networks, seasonal trends, and customer feedback.
Objective
The travel agency aims to develop a comprehensive and advanced Business Intelligence (BI) dashboard to:
✔ Optimize travel operations by tracking bookings, cancellations, and cost structures.
✔ Enhance customer satisfaction through service quality and review analysis.
✔ Maximize profitability by evaluating margins, peak season trends, and marketing efforts.
Operational KPIs
🔹 Bookings by Package Type – Analyzing domestic, international, honeymoon, adventure, and custom packages.
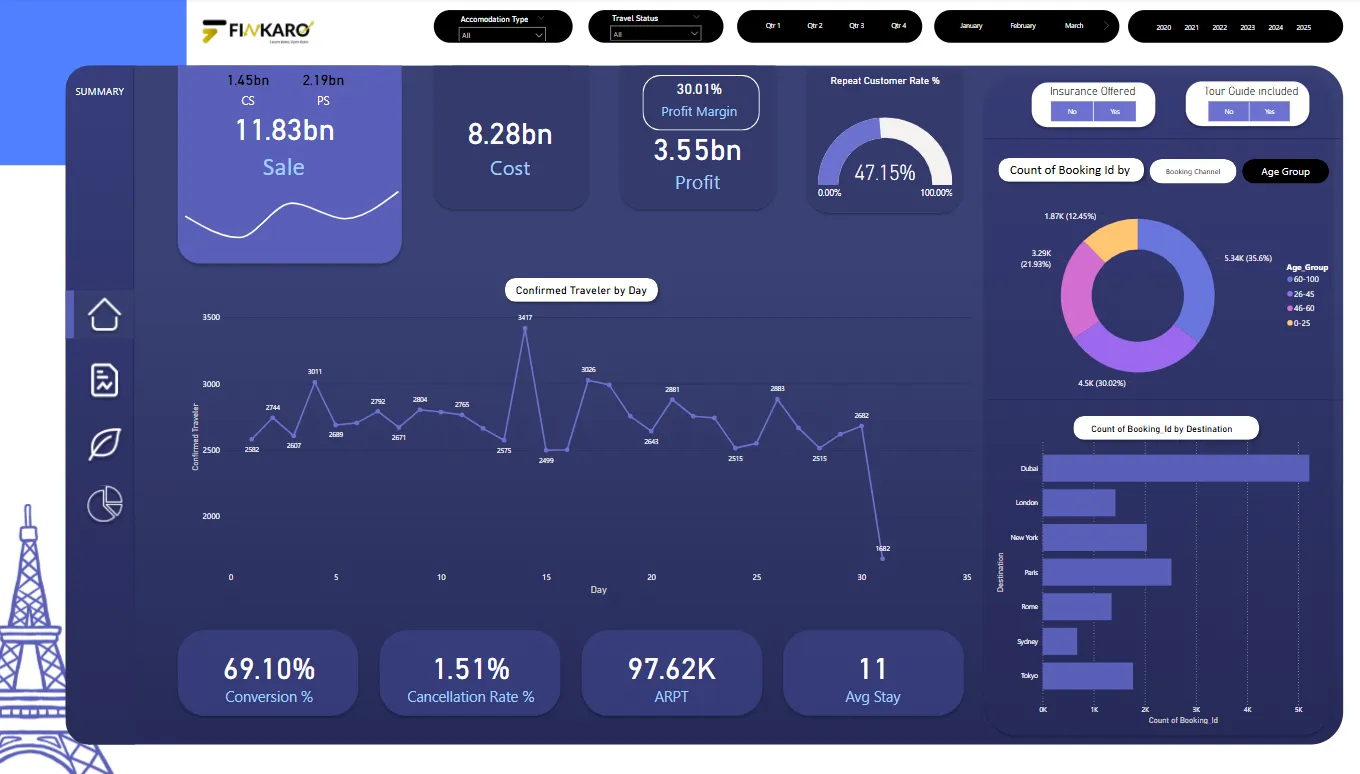
🔹 Booking Conversion Rate – Measuring leads converted into confirmed bookings.
🔹 Cancellation Rate – Tracking percentage of canceled bookings and reasons.
🔹 Average Booking Value (ABV) – Revenue earned per confirmed booking.
🔹 Lead Response Time – Speed of responding to customer inquiries.
🔹 Travel Seasonality Trends – Identifying high-demand months for proactive planning.
🔹 Accommodation & Transport Availability – Monitoring inventory levels for hotels, flights, and cars.
🔹 Customer Footfall (Online vs Walk-in) – Understanding customer engagement channels.
🔹 Tour Completion Feedback Score – Tracking customer satisfaction post-travel.
🔹 Agent Productivity & Task Efficiency – Measuring performance of travel advisors and staff.
Business Performance Metrics
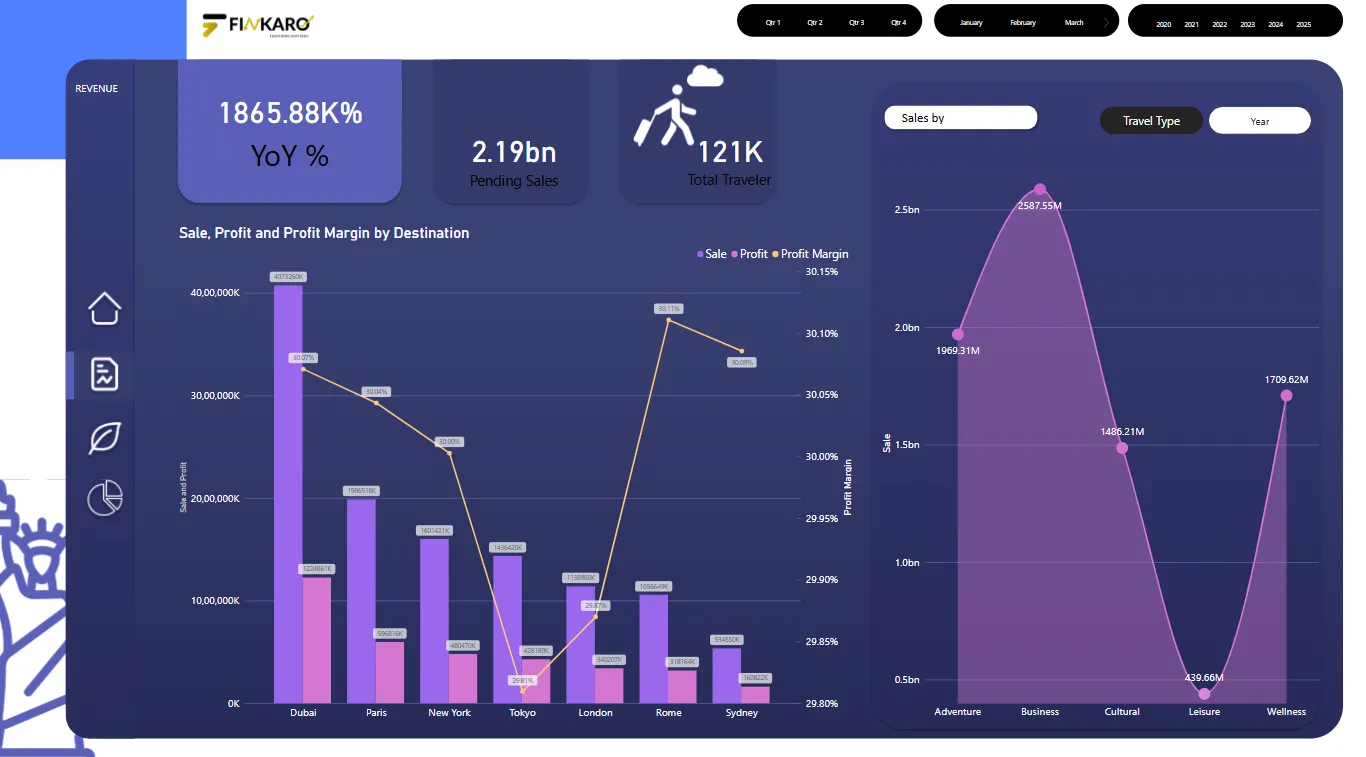
🔹 Revenue by Destination/Region – Tracking which destinations generate the most income.
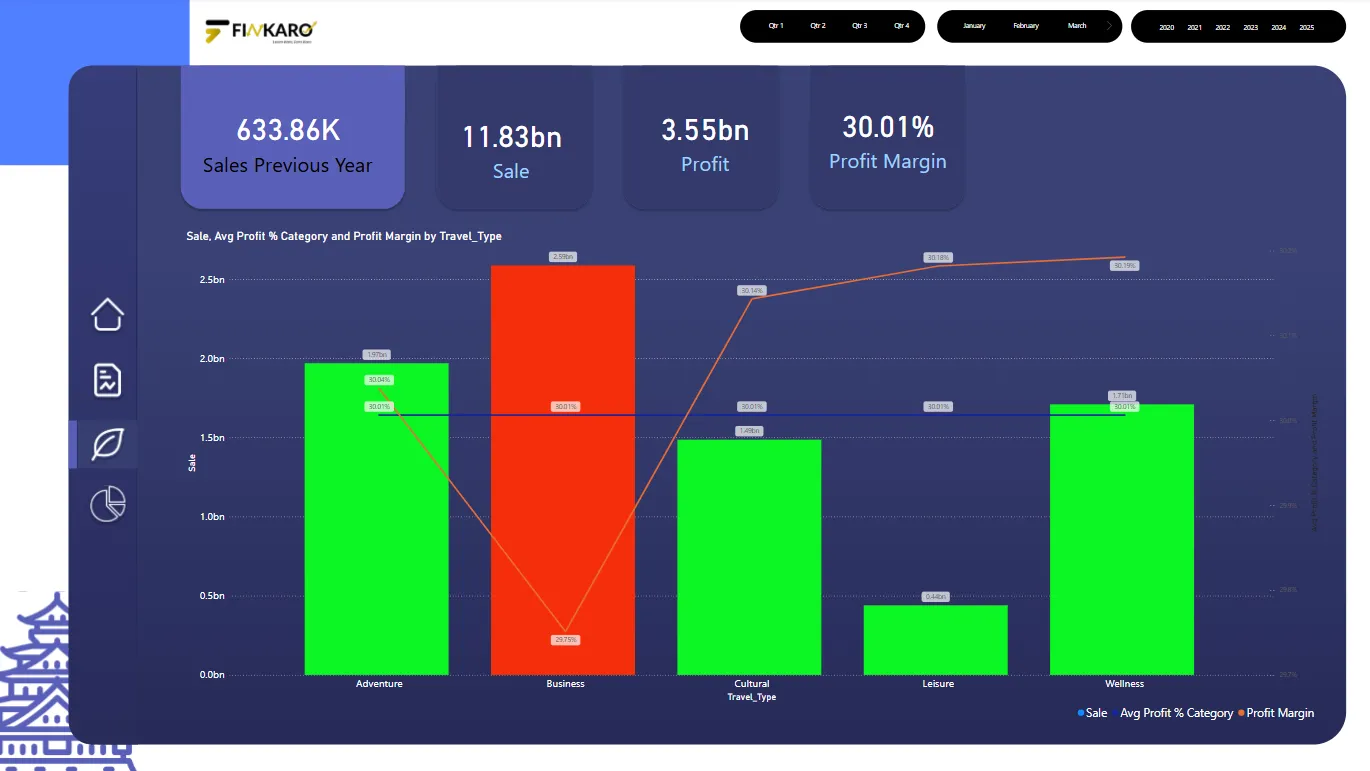
🔹 Profitability by Package Type – Comparing margins for different travel packages.
🔹 Customer Retention & Repeat Bookings – Evaluating loyalty and returning clients.
🔹 Marketing ROI (Campaign Spend vs New Leads/Bookings) – Assessing promotional impact.
🔹 Commission to Partners & Affiliates – Analyzing cost-effectiveness of third-party providers.
🔹 Operational Cost Breakdown – Monitoring spend on staffing, logistics, marketing, etc.
🔹 Net Promoter Score (NPS) – Evaluating likelihood of customer referrals.
🔹 Competitor Pricing Analysis – Benchmarking against market trends and package rates.
🔹 Seasonal Profitability Forecasting – Planning capacity and pricing based on expected demand.
Conclusion
This advanced travel business dashboard empowers agencies with real-time insights to optimize bookings, manage operational costs, and elevate customer service. By tracking both strategic and operational KPIs, the company can fine-tune offerings, increase margins, and stay competitive in a dynamic tourism landscape. 🌍📈🧳
You must be logged in to post a review.
Related products
Food Delivery Advanced level Dashboard for Monitoring
₹499Current price is: ₹499. Original price was: ₹1,299.
Training Institute Dashboard Using Power BI
₹499Current price is: ₹499. Original price was: ₹999.
Reviews
There are no reviews yet.